|
News
You are here
Race, Poverty, Class and COVID-19 in Toronto
June 4, 2020
The murder of George Floyd by 4 Minneapolis police officers brought widespread, large and angry protests and has starkly exposed the racial divides south of the border in the midst of this deadly pandemic.
But to claim, as Ontario Premier Doug Ford has, that Canada doesn’t have the same “systemic, deep roots” of racism as the U.S. is simply to ignore the history of the Canadian state.
The Canadian state and Indigenous Genocide
The RCMP was created to push Indigenous people off their land onto tiny reserves, uprooting people from the traditional ways that had sustained communities for millennia on Turtle Island. Forced assimilation through residential schools and other provisions of the racist Indian Acts have perpetrated an ongoing genocide against Indigenous peoples. The history of police violence against Indigenous people continues to this day, whether deployed as an army to invade Wet’suwet’en territory as the RCMP did in February, or in one on one interactions. Indigenous people make up 30% of those in custody across Canada, while representing about 4% of the population.
Anti-Black racism
Anti-Black racism also has a long history in Canada including slavery, the destruction of Africville and other black communities in Nova Scotia and the erasure of the history of black settlement in towns like Collingwood. It continues to this day with police carding of black people in cities like Toronto, a city where a recent Ontario human rights commission report found that black residents were 20 times more likely to be shot by police than white residents, and that where police force was used, black people were on the receiving end 61% of the time. The death of Regis Korchinski-Paquet while in the custody of Toronto police, along with the murder of George Floyd south of the border, were the sparks for a militant rally and march through the streets of Toronto on May 30, as similar protests have mushroomed across US cities, throughout Canada and across the world.
In Toronto these sparks lit a powder keg of pent up frustrations in communities of colour where cuts to education, public housing, public health infrastructure, public healthcare, community social programs over decades have become more acute under the conditions of the pandemic.
Over this same period, the police budget has skyrocketed. People of colour are more likely to work in essential services like healthcare, food service, cleaning and so during the pandemic they have often been working without adequate PPE.
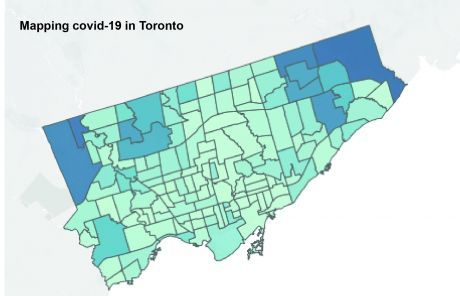
Mapping covid in Toronto
While Toronto Public Health has only recently begun gathering race-based data while contact tracing, making more comprehensive information unavailable at this time, the city of Toronto maintains an interactive neighborhood map showing the distribution of Covid-19 cases throughout the city. Since being posted late in May, it has revealed what many were already feeling: that a disproportionate number of cases are in neighbourhoods with higher percentages of visible minorities, and that socio-economic factors such as income and education level also influence infection rates.
Looking at the rate per 100,000 population measure and including all cases, at first glance the worst affected area of the city appears to be Humber Heights-Westmount at 1,580 per 100K population, appears not to fit this pattern. According to the 2016 census, this neighborhood had 27.2% visible minority population compared to 51.5% for the city as a whole, and the median income was slightly above average. But 100 of the 172 cases here have been at one privately run long term care facility in the area, The Village of Humber Heights, and the area population is only slightly above 10,000, ballooning the infection rate. Other neighbourhoods have larger populations, and there are varying densities of population across the city so care must be taken when analyzing these statistics and there are likely other anomalies hidden elsewhere in the data. Bear in mind that the statistical significance of the different comparisons contained below will vary depending on the neighborhood population sizes.
The continuing outbreaks in long term care facilities in Toronto and across the province and country shows clearly that this sector of the public health and healthcare systems has proven to be woefully inadequate for the challenge and requires an article of it's own to do it justice.
For these reasons, disregarding infections associated with outbreaks, which have occurred in long-term care facilities and hospitals where those infected do not necessarily live in the adjacent community, may provide a clearer picture of those areas where seemingly random community spread is most dangerous.
So after looking at only “sporadic” cases, the hardest hit neighbourhood is Black Creek (795.9 per 100K), followed by Weston (794.8), Maple Leaf (791.2) and Glenfield-Jane Heights (715). These areas are mostly clustered together in the north central part of the city.
The population of Black Creek is 80.9% visible minority with a median income of $46.5K, roughly $20K below the median income for the city as a whole, and 12.7% are unemployed, 3.5% higher than the city average. For housing, 66.6% of the population rent, compared to 47.2% for the city as a whole. For education, 11.7% of Black Creek residents have a Bachelor’s degree or higher, compared to 44.1% for the city as a whole. Glenfield-Jane Heights, with a 76.6% visible minority population shows similar demographics for education and unemployment while having a slightly higher median income, while only 48.6% rent.
While Weston is only a little above average in visible minority population (60.8%), the median income is roughly $20K below the city average and 63.2% of residents rent. Maple Leaf is a small neighborhood of 10,000 people, with about average median income, 43.6% visible minorities and 25.3% having a Bachelor’s degree or higher.
Some of the wards in the city, such as Westhumber-Clairville in the north west corner of the city, are large geographically and contain distinct parts. As a whole this ward is near the top of the list by rate of infection, with 573.4 sporadic cases per 100K. But Rexdale, in the northern part of the ward has a higher visible minority population with more renters and lower household income than the southern part of the ward. It’s possible that it could be the hardest hit part of the city, but it’s hard to say based solely on this data.
What about the neighborhoods that show the least community infection?
The least hit area of the city is St Andrew-Windfields, located between the 401 and York Mills Rd from Yonge St to the Don River, with 44.9 sporadic cases per 100,000. While being close to the city average in visible minority population, it is an affluent area with a median income of $98K where 61.4% have a Bachelor’s degree or higher and only 33.3% rent.
People living in the Black Creek ward are almost 18 times more likely to be infected sporadically than those in St. Andrew-Windfields.
Elsewhere Danforth Village-Toronto has 62.1 sporadic cases per 100,000. It is white, with 25.8% visible minority population, a median income $10K above the city average and 52.9% holding a Bachelor’s degree or higher.
Forest Hill South has 158.4 sporadic cases per 100,000, a median income of $94.5K, only 16.8% visible minorities with 69.3% holding a Bachelor’s degree or higher.
These divides are stark, but none more so than the difference of outcomes between residents of Rosedale-Moore Park and North St. James Town. On opposite sides of Bloor street near Parliament these two neighborhoods illustrate the divides within Toronto. Rosedale-Moore Park is one of the richest areas of the city, with a median household income of $107K and a below average unemployment rate (6%). With only an 18.1% visible minority population, it’s one of the whitest neighbourhoods in Toronto. 72.4% of residents have a Bachelor’s degree or higher. The sporadic infection rate is 62.1 cases per 100K.
Contrast this with the situation across Bloor street in North St. James Town. The median income here is just over $41K with unemployment at 10.4%. 66.9% of residents are visible minorities and 45.9% have a Bachelor’s degree or higher. The sporadic infection rate is 392.2 cases per 100K, more than 6 times the rate in Rosedale-Moore Park.
Also next door, the neighborhood of Cabbagetown-South St. James Town has a sporadic infection rate of 162.8 cases per 100K, about 41.5% of the North St. James Town rate. This area is just under the median income for the city at $61K and has an unemployment rate of 8%. 28.9% of the population are from visible minorities and 55.9% have a Bachelor’s degree or higher.
Clearly, both race and class have an impact on the likelihood of infection with Covid-19. One hopes that because Toronto Public Health is now gathering race and socio-economic data about people infected that the real picture of where the most urgent needs are can become clearer.
Section:
Featured Event

Events
-
August 9, 2026TorontoOrganized by:International Socialists and Marx21
Recent Videos


Visit our YouTube Channel for more videos:

Visit our UStream Channel for live videos: